Fancy colormaps
Introduction
The envtoolkit.colors.FancyCmap class is devoted to the use and creation of new
colormaps. They can either be read from .svg files, downloaded from
the cpt-city website (http://soliton.vm.bytemark.co.uk/pub/cpt-city/),
or created by using a list of named colors or an array of colors (in percentage)
Initialisation of the FancyCmap class
As a first step, one needs to initialize a envtoolkit.colors.FancyCmap class. This
class is initialised either by a string (the name of the .svg file
that contains the colormap), a list or a numpy array.
Initialisation using a string
The .svg files must be stored in a directory, which is accessed
through the $SVG environment variable. If one wants to use, for
instance, the colormap defined in the arctic.svg file,
the envtoolkit.colors.FancyCmap class is initialised as follows:
import envtoolkit.colors
obj = envtoolkit.colors.FancyCmap('arctic', reverse=False)
The reverse boolean indicates whether the colormap should be reversed or not (equivalent to putting a _r on the matplotlib colormap).
Initialisation using a list
A envtoolkit.colors.FancyCmap class can also be created by using a list of named
colors. This is achieved as follows:
import envtoolkit.colors
colors = ['gold', 'lightsalmon', 'purple',
         'orange', 'firebrick', 'lightskyblue']
obj = envtoolkit.colors.FancyCmap(colors, smooth=False, reverse=False)
If the smooth argument is set to False (which is the default setting), the colormap will be discrete. If it is set to False, the colormap will be of gradient type.
Initialisation using an array
A envtoolkit.colors.FancyCmap object can also be created by using a numpy.array that
contains rgb values (either in percentage or as 8 bits integer):
import envtoolkit.colors
colors = np.array([
             [10, 20, 30],
             [39, 100, 69],
             [100, 100, 100],
             [10, 50, 70],
             [100, 0, 0]
             ])/100.

obj = envtoolkit.colors.FancyCmap(colors, smooth=False)
User defined offset list
In the default mode, the offset (i.e. the location of the color edges on the colorbar) is automatically defined for a colormap initialised from a list or a RGB array. For instance, in a colorbar inialised with 5 colors (‘R’, ‘G’, ‘B’, ‘C’, ‘M’), we have the following cases, depending on the value of the smooth argument:
If smooth is False:
RRRRRRRRRRRRRRGGGGGGGGGGGGGGGBBBBBBBBBBBBBBCCCCCCCCCCCCCCMMMMMMMMMMMMMM
|-------------|-------------|-------------|-------------|-------------|
0            0.2           0.4           0.6           0.8            1
If smooth is True:
R      interp       G     interp    B     interp      C    interp   M
|-------------------|---------------|-----------------|-------------|
0                  0.25            0.5               0.75           1
with the interp meaning that the colors are linearly interpolated in between.
In the initialisation of the Fancycmap object, the user also has the possibility to use his own offset array (list_offset argument), which must contains as many values as colors:
offset = [0, 0.05, 0.1,  0.9, 0.95, 1]
svg = FancyCmap(input_cmap, list_offset=offset)
Again, the result will depend on the smooth option.
If smooth is False:
RRRRRRRGGGGGGGBBBBBBBBBBBBBBBBBBBBBBBBBBBBBBBBBBBBBBBCCCCCCCMMMMMMM
|------|------|--------------------------------------|-----|-------|
0   0.05     0.1                                    0.9   0.95     1
If smooth is True:
R   int   G         int          B         int           C   int   M
|---------|----------------------|-----------------------|---------|
0       0.075                   0.5                    0.925       1
Therefore, the real blue color in the smoothed colormap would be located at the middle of the blue color of the unsmoothed colormap. This is true for all the colors but the frst and the last one.
An example is provided in the Examples section.
Creation of the colormap
Now that the envtoolkit.colors.FancyCmap has been initialised, a colormap that
can be used by matplotlib must be created. This is achieved by the
envtoolkit.colors.FancyCmap.makecmap() function
cmap = obj.makecmap(N=256)
This function takes to optional arguments. The N integer provides the number of rgb quantization levels.
Definition of nice ticks
In the case of discrete and irregular colormaps (for instance, the
njavgcntyq.svg one), it might be nice to have the ticks of the
colormaps that match the color separations. This is achieved by the
envtoolkit.colors.FancyCmap.write_cbticks(), which takes as arguments the matplotlib.colorbar.Colorbar object.
import envtoolkit.colors
obj = envtoolkit.colors.FancyCmap('njavgcntyq')
cmap = obj.makecmap()
cs = plt.pcolor(x, y, Z, cmap=cmap)

plt.clim(lmin, lmax)
cb = plt.colorbar(cs)
obj.write_cbticks(cb)
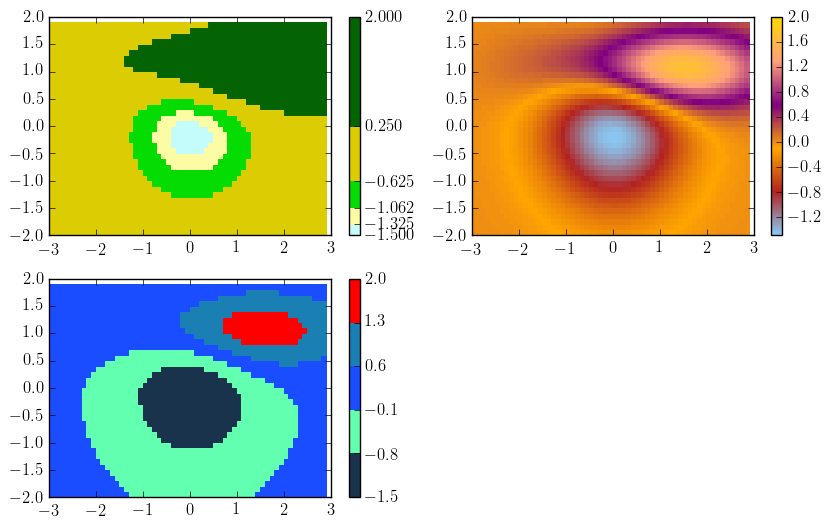
Examples
# Example of fancy colormaps use

import matplotlib.mlab as mlab
import matplotlib.pyplot as plt
import numpy as np
import envtoolkit.colors
import matplotlib.cm

# defining datasets to draw
# as in the contourf pyplot example
delta = 0.1
x = np.arange(-3.0, 3.0, delta)
y = np.arange(-2.0, 2.0, delta)
X, Y = np.meshgrid(x, y)
Z1 = mlab.bivariate_normal(X, Y, 1.0, 1.0, 0.0, 0.0)
Z2 = mlab.bivariate_normal(X, Y, 1.5, 0.5, 1, 1)
Z = 10.0 * (Z2 - Z1)
lmin, lmax = -1.5, 2

plt.figure(figsize=(10, 6))

plt.subplot(2, 2, 1)
# creating a Fancy cmap from a svg file
obj = envtoolkit.colors.FancyCmap('njgs/njavgcntyq.svg', reverse=False)
cmap = obj.makecmap()  # generating the cmap
cs = plt.pcolor(x, y, Z, cmap=cmap)
plt.clim(lmin, lmax)
cb = plt.colorbar(cs)
ticks = obj.generate_cbticks(cb)
cb.set_ticks(ticks)

plt.subplot(2, 2, 2)
vect = ['gold', 'lightsalmon', 'Purple',
        'orange', 'firebrick', 'lightskyblue']
# creating a gradient-type cmap from a list of colors
obj = envtoolkit.colors.FancyCmap(vect, smooth=True, reverse=True)
cmap = obj.makecmap()
cs = plt.pcolor(x, y, Z, cmap=cmap)
plt.clim(lmin, lmax)
cb = plt.colorbar(cs)

plt.subplot(2, 2, 3)
vect = np.array([[10, 20, 30],
                 [39, 100, 69],
                 [10, 30, 100],
                 [10, 50, 70],
                 [100, 0, 0]])/100.
# generating a discrete cmap from a numpy array of RGB percentage
obj = envtoolkit.colors.FancyCmap(vect, smooth=False)
cmap = obj.makecmap()
cs = plt.pcolor(x, y, Z, cmap=cmap)
plt.clim(lmin, lmax)
cb = plt.colorbar(cs)
ticks = obj.generate_cbticks(cb)
cb.set_ticks(ticks)

plt.savefig('figure_fancycmap.png', bbox_inches='tight')
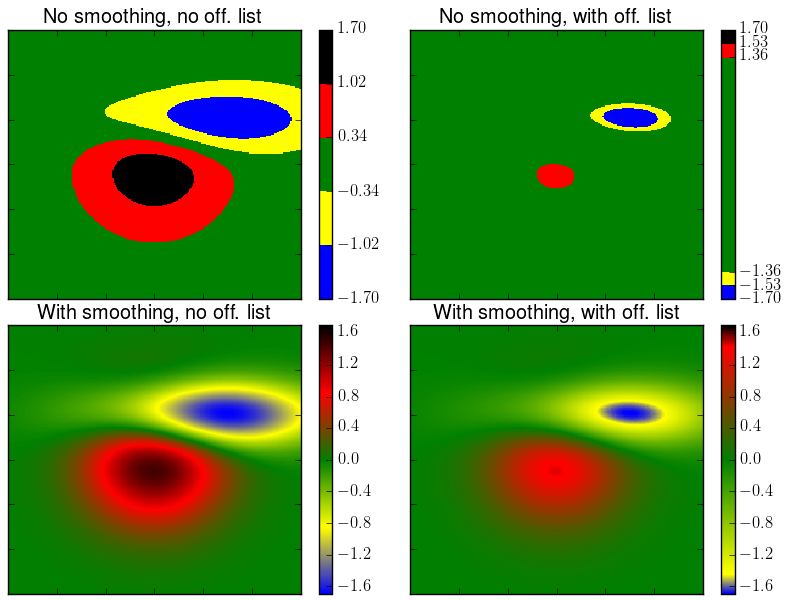
# Example on using user-defined color mapping offsets

import numpy as np
from pylab import *
from envtoolkit.colors import FancyCmap

# defining the five colors of the colormap and the
# mapping offset values
input_cmap = ['Blue', 'Yellow', 'Green', 'Red', 'Black']
offset = [0, 0.05, 0.1,  0.9, 0.95, 1]

# defining the color limits of the plots
cmin = -1.7
cmax = -cmin

# generating two smoothed colormaps.
# one with user-defined mappings, one without
smooth = True
svgsm = FancyCmap(input_cmap, smooth=smooth)
svgsmbis = FancyCmap(input_cmap, smooth=smooth, list_offset=offset)

# generating two discrete colormaps.
# one with user-defined mappings, one without
smooth = False
svg = FancyCmap(input_cmap, smooth=smooth)
svgbis = FancyCmap(input_cmap, smooth=smooth, list_offset=offset)

# generating data to plot
delta = 0.025
x = y = np.arange(-3.0, 3.01, delta)
X, Y = np.meshgrid(x, y)
Z1 = plt.mlab.bivariate_normal(X, Y, 1.0, 1.0, 0.0, 0.0)
Z2 = plt.mlab.bivariate_normal(X, Y, 1.5, 0.5, 1, 1)
Z = 10 * (Z1 - Z2)

# plotting
fig = figure()
subplots_adjust(wspace=0.1, hspace=0.1,
        bottom=0.01, top=0.95, left=0.01, right=0.97)

ax1 = subplot(2,2,1)
cs = pcolormesh(X,Y,Z, cmap=svg.makecmap())
cs.set_clim(cmin, cmax)
cb = colorbar(cs)
svg.write_cbticks(cb)
title('No smoothing, no off. list')

ax2 = subplot(2,2,2)
cs = pcolormesh(X,Y,Z, cmap=svgbis.makecmap())
cs.set_clim(cmin, cmax)
cb = colorbar(cs)
svgbis.write_cbticks(cb)
title('No smoothing, with off. list')

ax3 = subplot(2,2,3)
cs = pcolormesh(X,Y,Z, cmap=svgsm.makecmap())
cs.set_clim(cmin, cmax)
cb = colorbar(cs)
title('With smoothing, no off. list')

ax4 = subplot(2,2,4)
cs = pcolormesh(X,Y,Z, cmap=svgsmbis.makecmap())
cs.set_clim(cmin, cmax)
cb = colorbar(cs)
title('With smoothing, with off. list')

for ax in [ax1, ax2, ax3, ax4]:
    setp(ax.get_xticklabels(), visible=False)
    setp(ax.get_yticklabels(), visible=False)

savefig('figure_fancycmap_offsets.png')