Lanczos filtering
Introduction
The envtoolkit.ts.Lanczos class allows to perform temporal filtering of data.
Creation of the filter
As a first step, the user must create a filter. This is done by initialising the envtoolkit.ts.Lanczos as follows:
import envtoolkit.ts

nwts = 61
ta = 365
dt = 1
filthp = envtoolkit.ts.Lanczos("bp", nwts, ta)
The initialisation takes as argument the type of filter (hp for high-pass filter, lp for low-pass filter and bp for high pass filter), the number of weights (must be an odd number), the cut-off period ta. Additional arguments are the second cut-off periods for band-pass filter tb (default is None) and the time-step dt (default is 1, must have the same units as ta and tb).
Filtering a time-series
The filtering of a time series is achieved by using the envtoolkit.ts.Lanczos.wgt_runave() function, which is largely inspired from NCL’s function. This function is called as follows:
ts_filt = filthp.wgt_runave(ts)
with ts a data of any dimension.
Example
from netCDF4 import Dataset
import pylab as plt
from netcdftime import utime
import envtoolkit.ts
import numpy as np
import matplotlib
fin = Dataset("ts_sst.nc", "r")
time = fin.variables['time']
units = time.units
time = time[:]
data = fin.variables["sst"][:, 0, 0]
cdftime = utime(units)
date = cdftime.num2date(time)
datestr = np.array([d.strftime("%Y-%m-%d") for d in date])
days = np.array([d.day for d in date])
month = np.array([d.month for d in date])
iticks = np.nonzero((days == 1) & (month == 1))[0][::2]
# processing daily time scales
yyyymmdd = envtoolkit.ts.make_yymmdd(date)
dclim = envtoolkit.ts.compute_daily_clim(data, yyyymmdd)
danom = envtoolkit.ts.compute_daily_anom(data, yyyymmdd, dclim)
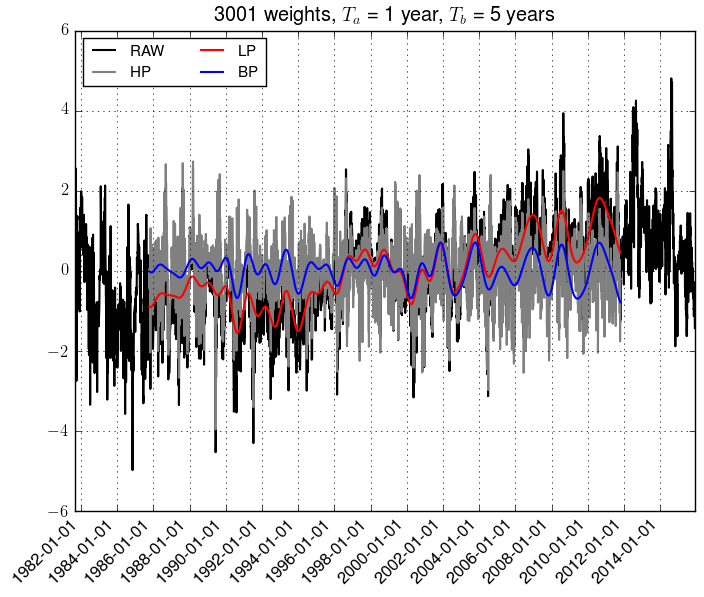
nwts = 3001
tcuta = 1*365.
tcutb = 5*365.
lanchp = envtoolkit.ts.Lanczos("hp", nwts, tcuta)
lanclp = envtoolkit.ts.Lanczos("lp", nwts, tcuta)
lancbp = envtoolkit.ts.Lanczos("bp", nwts, tcuta, tcutb)
tshp = lanchp.wgt_runave(danom)
tslp = lanclp.wgt_runave(danom)
tsbp = lancbp.wgt_runave(danom)
prop = matplotlib.font_manager.FontProperties(size=11)
fig = plt.figure()
ax = plt.subplot(111)
plt.plot(time, danom, label="RAW")
plt.plot(time, tshp, label="HP", color="gray")
plt.plot(time, tslp, label="LP", color="red")
plt.plot(time, tsbp, label="BP", color="blue")
plt.xlim(time.min(), time.max())
plt.grid(True)
plt.legend(loc=0, prop=prop, ncol=2)
plt.title(r'%d weights, $T_a$ = 1 year, $T_b$ = 5 years' %nwts)
ax.set_xticks(time[iticks])
ax.set_xticklabels(datestr[iticks], rotation=45, ha="right")
plt.savefig('figure_lanczos.png', bbox_inches="tight")